Checking Memory Details & RAM Diagnosis with Windows Memory Diagnostic Tool
Checking Memory Details & RAM Diagnosis With Windows Diagnosing Tool
Checking Memory Details in Windows
About RAM : RAM (Random Access Memory) is the internal memory of the CPU for storing data, program, and program result. It is a read/write memory which stores data until the machine is working
we can check the RAM details by different methods, some of us are-
From Settings
- search settings in the windows search bar and and open setting.
- search in setting "About your PC" and click to open the filed.
- You an see the system specifications along with the RAM details.
From Command Prompt
- Click Windows key + R and type CMD then click to open the Command Prompt.
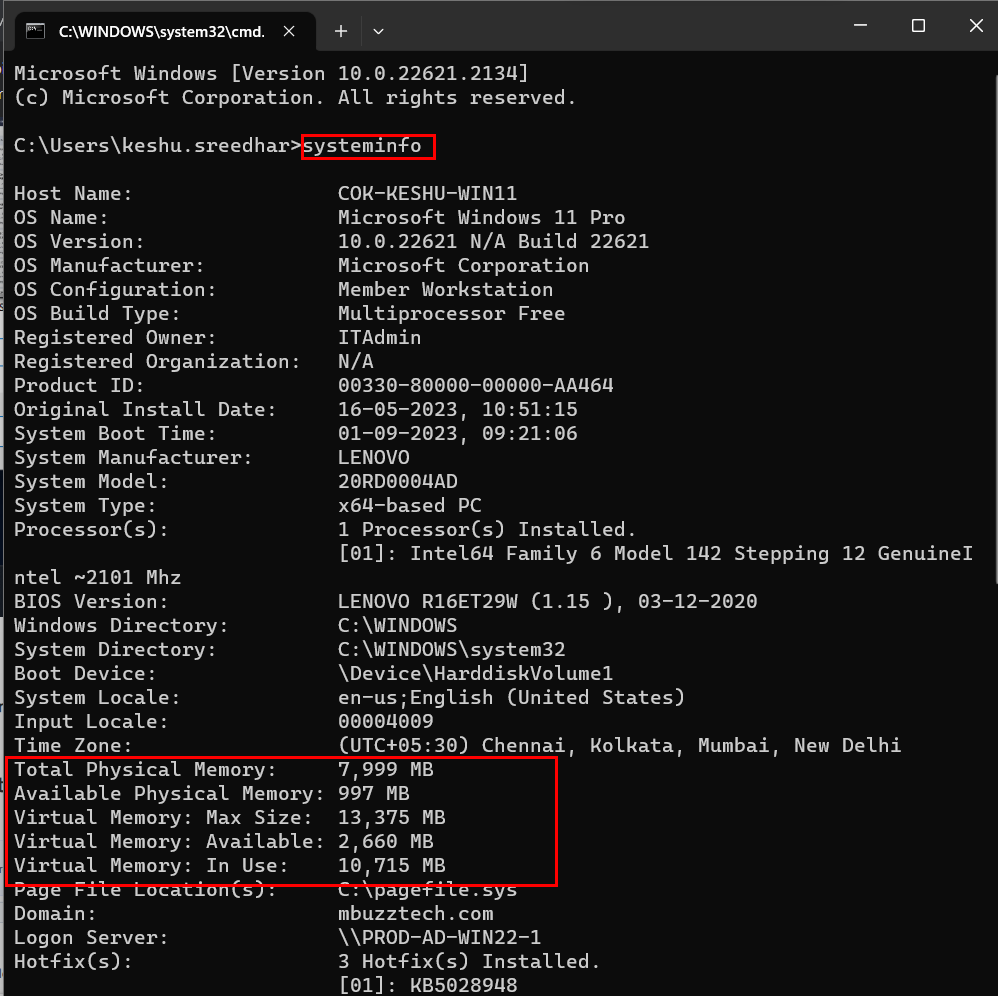
- Type system info then click enter here you can see whole system information with memory details.
From Task Manager
- Search Task Manager in windows search bar and open the application.
- Click the performance tab on the left and select memory here you can see the memory details of the device
From BIOS
- Restart the system and press BIOS Key (F2/F12/F10) to get into BIOS you can see the memory details here.
RAM Diagnosis with Windows Memory Diagnostic Tool
Faulty RAM can cause many problems like crashing ,freezing, blue screen issue etc...,In windows 10 &11 we can test our memory using windows memory diagnosis tool.
- click Windows +R and type "mdshed" on the dialog box then click ok
- select Restart now and check for problems.
- change the test to standard and let it run.
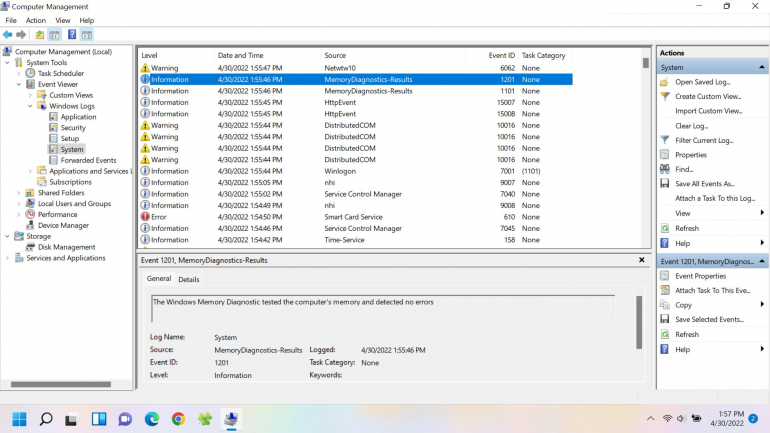
The Standard test should work for most troubleshooting scenarios. The test can take upwards of 20 or 30 minutes depending on the memory configuration.Once the test is complete, Windows will continue to start and a pop-up will eventually appear showing the results.Also we can view the results by right-clicking the Start icon>selecting Computer Management>expanding Event Viewer>expanding Windows Logs>clicking System and then selecting the most recent log with Memory Diagnostics-Results as in the below picture.If any errors are listed, your RAM might be faulty.